Plotting Fractals in WebAssembly
Plotting Fractals in WebAssembly
| Previous | Top | Next |
|---|---|---|
| 1: Plotting Fractals | 2: Initial Implementation |
1: Plotting Fractals
To create any sort of fractal image, it is necessary to repeatedly evaluate a function that takes a complex number as input and gives another complex number as output. This output value is then fed back into the original equation and a new value is generated.
In order to calculate the colour of one pixel, we must repeat this iterative calculation hundreds, if not thousands of times.
As you can imagine, this type of coding is completely CPU-bound, and is therefore ideally suited for implementation in WebAssembly.
Very conveniently, the value of any one pixel in a fractal image is quite unrelated to the value of any neighbouring pixels; therefore, the calculation of the overall image is said to be “embarrassingly parallel”. That is, we can greatly improve the performance of image calculation by creating multiple, independent instances of the same program, and then sharing out the pixel claculations across these instances.
This optimisation will also be demonstrated here.
The Mandelbrot Set
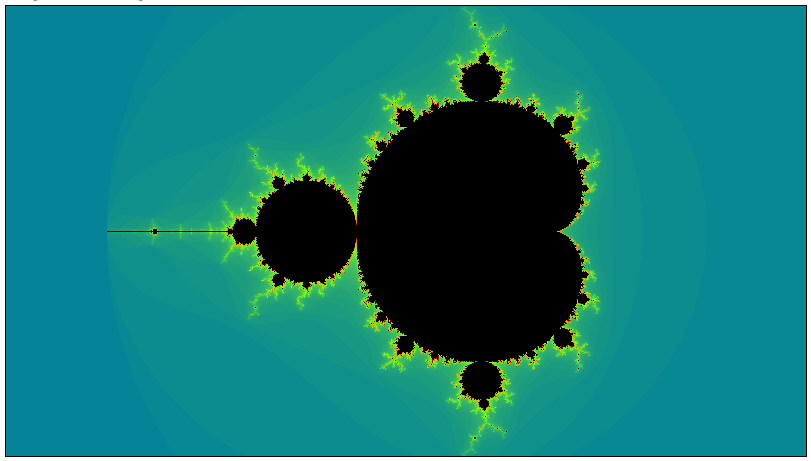
The Mandelbrot Set is created as follows:
- First, decide on two arbitrary limits:
- What is the maximum number of times we will iterate the calculation before giving up?
This value is known as as
max_itersand a reasonable starting value is1000 - Each time we iterate the calculation, we get out a complex number that might well start to grow.
It is very important to decide how big we should allow this number to become before stopping (since in some cases, it’s only going to continue growing).
This limit is called
bailoutand is typically set to4
- What is the maximum number of times we will iterate the calculation before giving up?
This value is known as as
-
Using this equation:
Starting with Z0 = 0 and
cas the coordinate value of some pixel in the image, a new value (Z1) can then be derived.Keeping
cthe same, we now simply put the value of Z1 back into the equation to derive Z2, then Z3 and Z4 and so on until either|Z| > bailoutor we hit the iteration limit defined bymax_itersWe are not so much interested in what the last value of Zn is; instead, we’re interested in the number of times around the loop we had to go before satisfying the termination condition.
-
Colour each pixel according to the number of times the equation is iterated. Any pixel whose iteration count hits
max_itersis arbitrarily coloured black. The other pixels can be coloured according whatever aesthetically pleasing colour scheme you choose - Repeat steps 2 and 3 for every pixel in the image
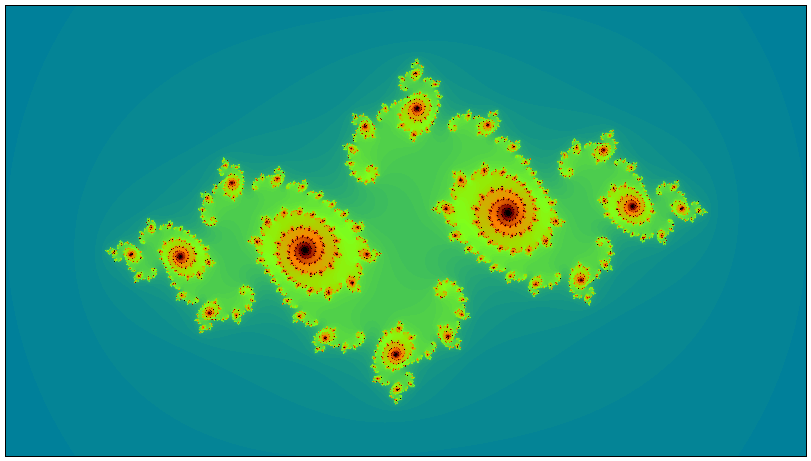
Julia Sets
For every point on the Mandelbrot Set, there is a corresponding Julia Set.
This means that instead of starting the above iteration with Z0 = 0, we start with Z0 set to the coordinate value of the mouse pointer position. As you can imagine, this means that there are an infinite number of possible Julia Sets.
The one shown below corresponds to the location (-0.755, -0.19) on the Mandelbrot Set.