Plotting Fractals in WebAssembly
Plotting Fractals in WebAssembly
| Previous | Top | Next |
|---|---|---|
| 2: Initial Implementation | 3: Basic WAT Implementation | 4: Optimised WAT Implementation |
| 3.5: Calculating the Mandelbrot Set Image | 3.6: Displaying the Rendered Fractal Image |
3.6: Displaying the Rendered Fractal Image
Now that the WebAssembly side of the coding has been written, we need an HTML page to display the rendered image.
IMPORTANT
For security reasons, WebAssembly .wasm files cannot be opened by a browser from the local file system using the file:// protocol.
In order for the Web page shown below to function correctly, it must be served to your browser from a Web server.
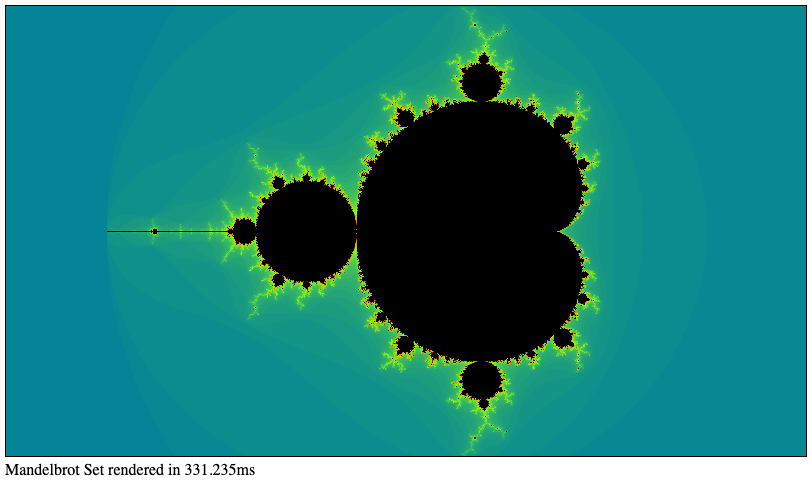
In the above image, notice that without any optimisation, our basic implementation takes several hundred milliseconds to complete — which is pretty slow…
<!DOCTYPE html>
<html>
<head>
<meta charset="UTF-8">
<title>Basic WAT Implementation of the Mandelbrot Set</title>
</head>
<body>
  <canvas id="mandelImage" style="border: 1px solid black"></canvas>
  <div>Mandelbrot Set rendered in <span id="runtime"></span>ms</div>
  <script>
const microPrecision = val => Math.round(val * 10000) / 10000
const WASM_PAGE_SIZE    = 1024 * 64
const DEFAULT_MAX_ITERS = 1000

// - - - - - - - - - - - - - - - - - - - - - - - - - - - - - - - - - - - - - - - - - - - - - - - -
// Canvas
const DEFAULT_X_ORIGIN = -0.5
const DEFAULT_Y_ORIGIN = 0
const CANVAS_WIDTH     = 800
const CANVAS_HEIGHT    = 450

const PPU = CANVAS_WIDTH / 4 // Pixels per unit in the complex plane

const mCanvas  = document.getElementById('mandelImage')
mCanvas.width  = CANVAS_WIDTH
mCanvas.height = CANVAS_HEIGHT

const mContext    = mCanvas.getContext('2d')
const mImage      = mContext.createImageData(mCanvas.width, mCanvas.height)
const mImagePages = Math.ceil(mImage.data.length / WASM_PAGE_SIZE)

const palettePages = 2

// - - - - - - - - - - - - - - - - - - - - - - - - - - - - - - - - - - - - - - - - - - - - - - - -
// Create WASM shared memory and object for sharing resources from the host environment
const wasmMemory = new WebAssembly.Memory({
  initial : mImagePages + palettePages
})

const wasmMem8 = new Uint8ClampedArray(wasmMemory.buffer)

const host_fns = {
  js : {
    shared_mem : wasmMemory,
    image_offset : 0,
    palette_offset : WASM_PAGE_SIZE * mImagePages,
  }
}

// - - - - - - - - - - - - - - - - - - - - - - - - - - - - - - - - - - - - - - - - - - - - - - - -
// Async function to create and execute WASM instance
const start = async () => {
  const wasmObj = await WebAssembly.instantiateStreaming(
    fetch('./mandel_plot.wasm'),
    host_fns
  )

  // Create the colour palette
  wasmObj.instance.exports.gen_palette(DEFAULT_MAX_ITERS)

  // Record the start time and render the Mandelbrot Set
  const start_time = performance.now()
  wasmObj.instance.exports.mandel_plot(
    CANVAS_WIDTH, CANVAS_HEIGHT,
    DEFAULT_X_ORIGIN, DEFAULT_Y_ORIGIN,
    PPU, DEFAULT_MAX_ITERS,
  )

  document.getElementById("runtime").innerHTML = microPrecision(performance.now() - start_time)

  // Transfer the relevant slice of shared memory to the image, then display it in the canvas
  mImage.data.set(wasmMem8.slice(0, mImage.data.length))
  mContext.putImageData(mImage, 0, 0)
}

start()
</script>
</body>
</html>
The JavaScript coding in this Web page does the following things:
-
Defines various constant values and a helper function called
microPrecisionthat returns a time value rounded to the nearest microsecond. -
Accesses the HTML
canvaselement calledmandelImage, defines its dimensions and works out how many WebAssembly memory pages will be needed for an image of that particular size -
Allocates the required amount of WebAssembly memory
-
Defines a two-layer object that references the various host resources being shared with the WebAssembly module
- Within an asynchronous function called
start:- Instantiate the WebAssembly module
- Call the WebAssembly function to generate the colour palette
- Making a note of the start time, call the WebAssembly function to generate the Mandelbrot Set, then display the execution time
- Display the rendered image by transferring the relevant slice of shared memory to the HTML
canvaselement
- Calls the asynchronous
start()function