Plotting Fractals in WebAssembly
Plotting Fractals in WebAssembly
| Previous | Top | Next |
|---|---|---|
| 6: Zooming In | 7: WebAssembly and Web Workers | |
| 7.3 Create the Web Worker | 7.4 Adapt the Main Thread Coding | |
| 7.4.1 Extend the HTML | 7.4.2 Split WebAssembly Coding |
7.4.1 Extend the HTML
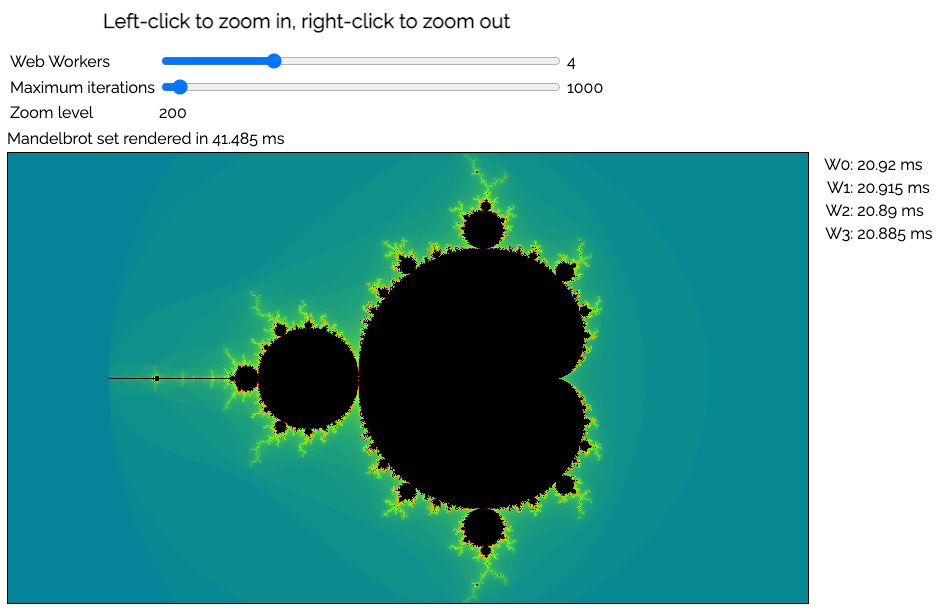
Since we are demonstrating the performance improvements that can be made with Web Workers, it would be helpful if the number of worker threads can be adjusted dynamically. Also, we will need to display not only the overall execution time, but also the individual execution times of each worker thread.
Therefore, the canvas elements will be placed inside a table, and down the right side of the Mandelbrot Set canvas, we will have another table showing the last execution time of each worker thread.

